
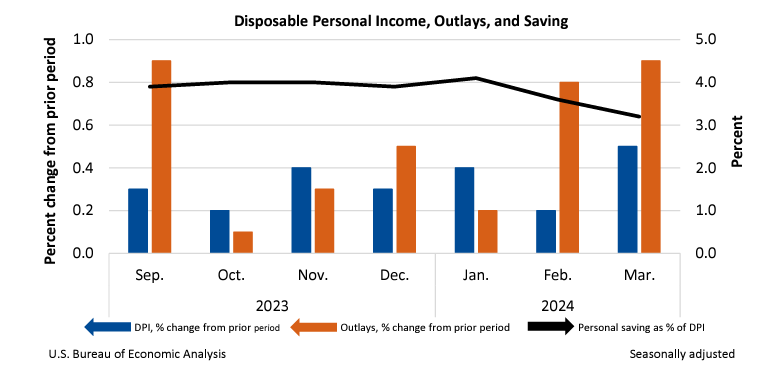
Personal income increased $122.0 billion (0.5 percent at a monthly rate) in March. Disposable personal income —personal income less personal current taxes—increased $104.0 billion (0.5 percent). Personal outlays—the sum of personal consumption expenditures, personal interest payments, and personal current transfer payments—increased $172.1 billion (0.9 percent) and consumer spending increased $160.9 billion (0.8 percent). Personal saving was $671.0 billion and the personal saving rate— personal saving as a percentage of disposable personal income—was 3.2 percent in March.
Personal income
In March, personal income increased, primarily reflecting an increase in compensation.
- Within compensation, the increase was led by private wages and salaries, based on data from the Bureau of Labor Statistics’ Current Employment Statistics. Services-producing industries increased $53.1 billion and goods-producing industries increased $18.0 billion.
Consumer spending
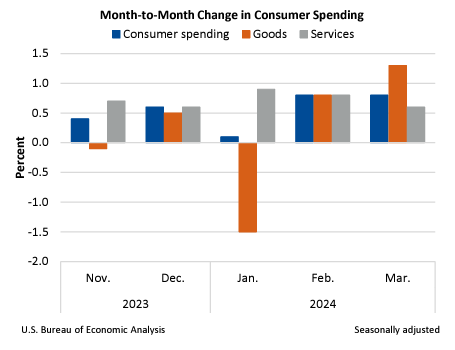
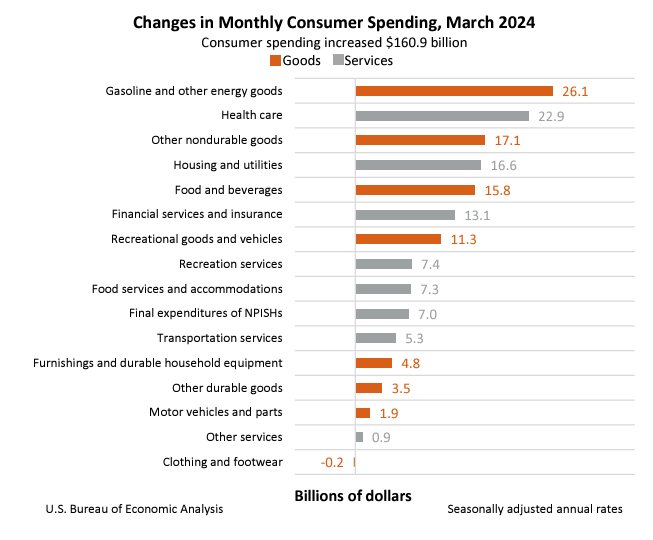
The $160.9 billion increase in consumer spending in March reflected an increase in spending for both services and goods.
- Within services, the largest contributors to the increase were health care (both outpatient and hospital services), based on BLS CES data, and housing and utilities (led by housing).
- Within goods, the largest contributors to the increase were gasoline and other energy goods (led by motor vehicle fuels, lubricants, and fluids), based on Energy Information Administration data; other nondurable goods (led by recreational items), based on Monthly Retail Trade Survey (MRTS) data; and food and beverages, based on MRTS data.
PCE price index
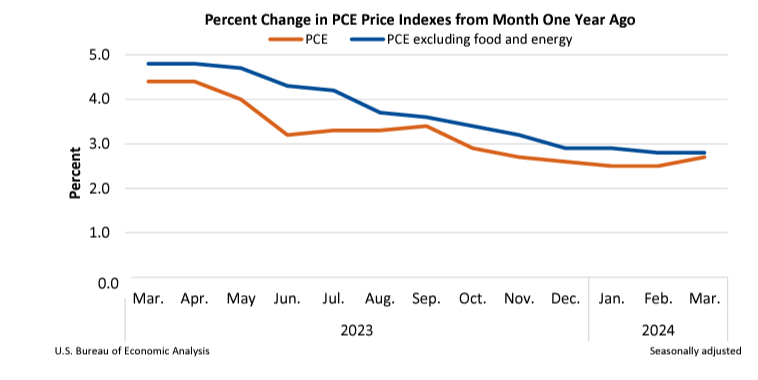
From the preceding month, the PCE price index for March increased 0.3 percent. Prices for services increased 0.4 percent and prices for goods increased 0.1 percent. Food prices decreased less than 0.1 percent and energy prices increased 1.2 percent. Excluding food and energy, the PCE price index increased 0.3 percent. For a comparison of PCE prices to BLS consumer price indexes, refer to Table 9.1U. Reconciliation of Percent Change in the CPI with Percent Change in the PCE Price Index.
From the same month one year ago, the PCE price index for March increased 2.7 percent. Prices for services increased 4.0 percent and prices for goods increased 0.1 percent. Food prices increased 1.5 percent and energy prices increased 2.6 percent. Excluding food and energy, the PCE price index increased 2.8 percent from one year ago.
Real disposable personal income and consumer spending
Real DPI increased 0.2 percent in March. Real consumer spending increased 0.5 percent, reflecting an increase in spending on goods of 1.1 percent and an increase in spending on services of 0.2 percent. Within goods, the leading contributors to the increase were gasoline and other energy goods (led by motor vehicle fuels, lubricants, and fluids), other nondurable goods (led by recreational items), and food and beverages. Within services, the largest contributor to the increase was health care (both outpatient and hospital services).
For more information, read the full release.